How Much Conversion Data Is Your Store Actually Losing Right Now?
"Some data is probably lost" is easy to ignore. A specific dollar figure isn't. Here's a step-by-step way to calculate exactly what your tracking gap is actually costing you.
How Much Conversion Data Is Your Store Actually Losing Right Now?
"Some data is probably lost" is easy to shrug off.
"You're missing 38% of your conversions, and it's costing approximately $4,200 in misattributed ad spend every month" is not.
This post gives you a way to calculate the second number. Not a rough guess - a step-by-step estimate based on your actual traffic profile, platform mix, and current tracking setup.
By the end, you'll know whether you have a small nuisance or an active money drain. And you'll know exactly what fixing it is worth.
The Thing Most Guides Get Wrong: Loss Layers Stack
Most articles on tracking loss treat each source separately. iOS loss over here. Ad blockers over there. Safari ITP in another column.
That's not how it works.
The losses stack — and they compound on each other. A visitor on an iPhone using Safari with an ad blocker who declines your consent banner is invisible three times over. Their visit, their clicks, their purchase - none of it reaches your ad platforms. Three separate mechanisms each independently failed to capture the same person.
This is why real-world data loss tends to be higher than any single-source estimate suggests. When you add up the layers, the total is worse than the sum of the parts.
Here's how to estimate what's happening in your store specifically.
Step 1: Pull Your Traffic Profile from GA4
Open GA4 → Reports → Acquisition → Traffic Acquisition.
Note down:
Total monthly sessions
Mobile sessions as a percentage of total
Safari share of sessions (find this under Tech → Browser)
These three numbers feed every calculation below. Write them down before continuing.
Step 2: Calculate Your iOS Attribution Loss
iOS is the single largest source of tracking loss for most stores - and it's been getting worse since 2021.
Apple's App Tracking Transparency (iOS 14.5+) requires users to opt in to cross-app tracking. Opt-out rates in consumer contexts run at 70–80%. iOS 17 added Link Tracking Protection on top of that — stripping the fbclid and gclid parameters from links opened in Safari or shared through Messages. The click that connected your ad to the visit gets deleted before your Pixel ever sees it.
Estimated loss rate for iOS users: 60–75% of conversions either fail to attribute or don't register at all.
Your calculation:
iOS Safari sessions × conversion rate × 65% = iOS attribution loss
Example: 10,000 iOS sessions × 2% conversion rate × 65% = 130 lost conversions/month
Step 3: Calculate Your Ad Blocker Loss
Ad blockers now hide 42.7% of internet users from Google Analytics tracking, with ecommerce stores losing 13–20% of visitor data depending on audience demographics.
But here's the part most guides bury: the demographics most likely to use ad blockers - young, tech-savvy adults - are often the highest-value e-commerce audiences. If your store targets 25–34-year-olds, a disproportionate share of your best potential customers are the ones your Pixel can't see.
Loss rate varies by audience type: B2C ecommerce averages 13–20% of sessions blocked. B2B and tech audiences run 30–40%. If you sell to a technical or privacy-conscious demographic, use the higher end.
Estimated loss rate for blocked sessions: 85–95% of those sessions generate zero tracking data.
Your calculation (without CAPI):
Total sessions × 18% (mid-range) × conversion rate × 90% = ad blocker loss
Example: 50,000 sessions × 18% blocked × 2% conversion rate × 90% = 162 lost conversions/month
If you have CAPI running: server-to-server events bypass browser blocking entirely. Ad blocker loss for conversion events drops by approximately 40–60% when CAPI is correctly configured with customer data.
How to measure your actual ad blocker rate: Compare your GA4 session count against your server access logs or CDN analytics for the same period. The percentage gap between the two is approximately your ad blocker rate - measured against your actual audience, not an industry average.
Step 4: Calculate Your Safari ITP Loss
Safari's Intelligent Tracking Prevention limits tracking cookies set by third-party scripts to 7 days. After that, the cookie expires.
If someone clicks your Facebook ad on a Monday, doesn't buy, and comes back 8 days later to purchase - the Pixel's cookie is gone. The sale happens but the ad that drove it gets no credit. The customer shows up in Shopify; it doesn't show up in Meta.
This hits hardest for stores with longer consideration windows — furniture, electronics, fashion, anything with a higher price point that invites comparison shopping.
Estimated ITP loss rate: 15–25% of Safari conversions with multi-visit purchase paths.
Your calculation:
Safari sessions × 40% (multi-visit estimate) × 20% ITP rate = ITP loss
Example: 15,000 Safari sessions × 40% × 20% = 1,200 affected sessions → ~24 lost conversions at 2% conversion rate
Step 5: Add the EU Consent Layer (If Relevant)
If you have significant EU traffic, add a third loss layer: consent rejection.
GDPR requires consent banners for EU visitors. Rejection rates vary by region and banner design, but a meaningful portion of EU visitors decline tracking entirely. Those visitors don't trigger any marketing events - Pixel, CAPI, or otherwise.
This layer compounds with iOS and ad blocker loss. A German visitor on Safari with uBlock Origin who declines your cookie banner is invisible to client-side tracking through three independent mechanisms simultaneously.
If EU traffic is less than 10% of your total, this layer is minor. If EU traffic is significant, it meaningfully increases your total loss estimate - and also adds a compliance dimension to fixing it.
Step 6: Add It All Up
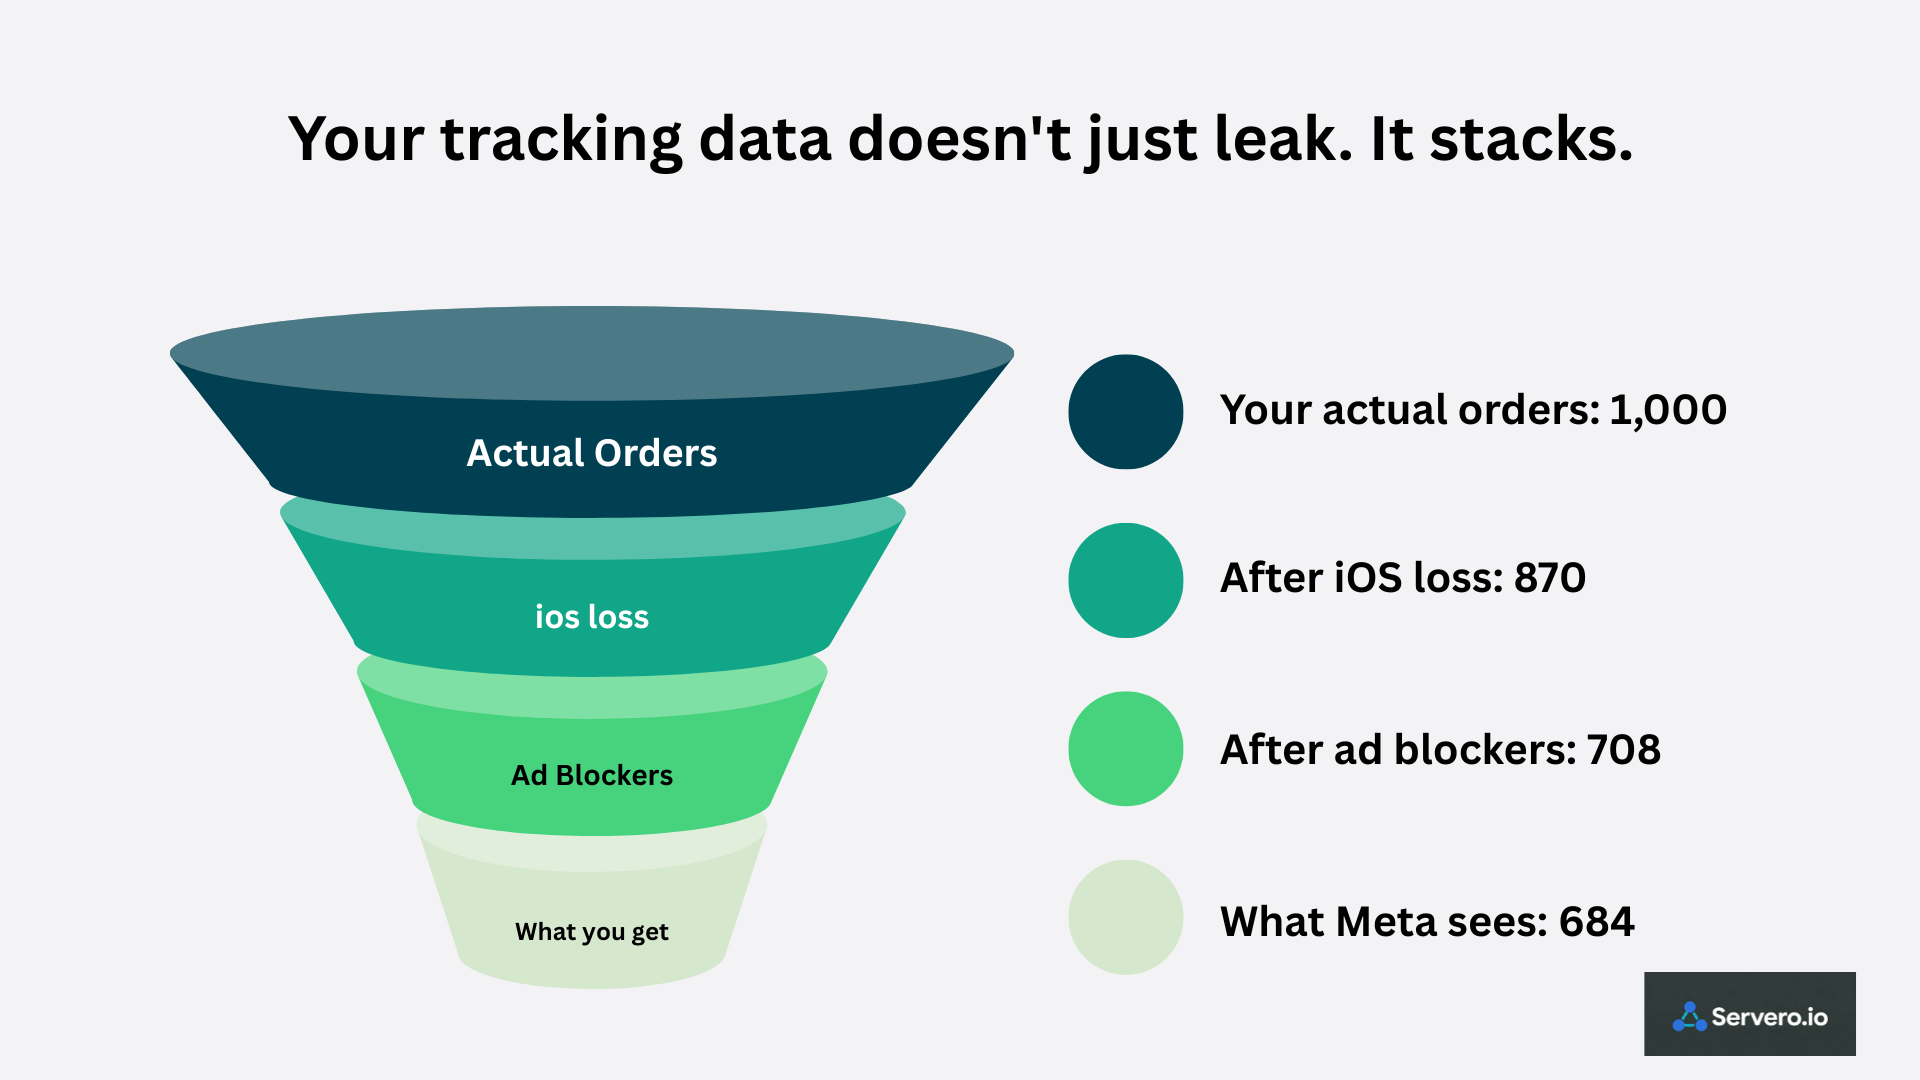
Here's the full picture for an example store: 50,000 monthly sessions, 2% conversion rate = 1,000 actual orders.
Loss Layer Estimated Lost Conversions iOS attribution loss ~130 Ad blocker loss (no CAPI) ~162 Safari ITP multi-session loss ~24 Total estimated loss ~316 conversions/month As % of actual orders ~32%
Meta and Google are seeing roughly 684 of your 1,000 monthly purchases. Their algorithms are optimizing on a picture missing nearly a third of reality.
Now apply your average order value. If your AOV is $90:
316 missing conversions × $90 AOV = $28,440/month your ad platforms can't see
That's the dollar value of the signal your platforms are missing. Every audience targeting decision, every budget allocation, every creative optimization - made on data that's $28,440 short of what actually happened.
What Fixing It Actually Recovers
Server-side tracking doesn't recover 100%. Nothing does. Here's what's realistic:
iOS loss: CAPI with first-party data (hashed email + phone) recovers 50–70% — Meta matches the conversion using customer identity rather than the stripped click parameter.
Ad blocker loss: CAPI recovers 40–60% — server-to-server events bypass browser blocking entirely.
Safari ITP: First-party cookies set by your sGTM server on your own subdomain aren't subject to ITP's 7-day limit, recovering a meaningful portion of multi-session attribution.
Total realistic recovery: 50–65% of the estimated loss.
For the example store: 50–65% of 316 = 158–205 additional attributed conversions per month.
At $90 AOV: $14,220–$18,450 in monthly revenue is now visible to Meta's algorithm.
Then the compounding benefit: better signals → smarter audience targeting → lower CPAs. Accounts with Meta EMQ scores of 8.0+ see 20–35% lower CPAs than accounts scoring below 4.0 using the same budget. That improvement shows up 3–4 weeks after the algorithm recalibrates to the cleaner signal.
The 2-Minute Diagnostic
Don't want to run the full calculation? Here's the quick version.
Open Meta Events Manager → your Purchase event.
Check two things:
Server events vs Browser events — if Server events are zero or near-zero, CAPI isn't running
Purchase count in Events Manager vs Shopify orders for the same period
Healthy: Server events close to Browser events. Combined count close to Shopify order count. Event Match Quality 7+.
Broken: Server events at zero. Combined event count well below Shopify. EMQ below 6.
The gap between Meta's purchase count and your actual Shopify orders, expressed as a percentage that's roughly your tracking loss. You now know what it costs.
Is It Worth Fixing?
Run the math for your store using the steps above. Then compare it to the cost of fixing it.
Managed sGTM hosting runs $17–$80/month depending on your traffic tier. Setup time with a managed platform is 1–2 hours. No developer required.
For most stores spending meaningful money on paid ads, the attribution recovery pays for the hosting cost within the first week. The ongoing monthly cost becomes noise.
The stores that don't fix tracking aren't saving money. They're spending ad budget that optimizes on bad data, and every month that compounds.
Want to close that gap in under 30 minutes? [Start free on Servero — no credit card needed →]